
Let’s start with the conclusion. This system runs on the Cloudflare Workers plan starting at $5/month. With load generated simultaneously from 5 AWS regions, the read path sustained about 850K RPS, peaked at 880K, and had zero worker errors. It was not overwhelmed; the load generators hit their bottleneck first.
It sounds absurd, but it does not rely on piling up machines. This article explains what it relies on, and also explains the two times it fell flat: the first time, we thought we had fixed it; the second time, we finally dug out the real root cause.
Why Build Our Own KV
The business scenario is drawing results ball by ball. Each ball result is written once, the data is valid for only 1 second, and a massive number of users poll that result every second. Cloudflare’s built-in Workers KV is eventually consistent; write propagation is measured in seconds or even tens of seconds, so it cannot be used for data that “expires after 1 second.” So we built one ourselves on Workers + Durable Objects.
Turn the Bottleneck into the Source of Consistency
The most disliked aspect of Durable Objects is that they are single-threaded: each object handles only one request at a time, while the rest wait in a queue. The instinctive reaction is to bypass it.
We did the opposite. Single-threading means all reads and writes for the same key are naturally serialized, with no race conditions. That is exactly the consistency the result data needs. So the design became: accept this single-threaded object as the sole source of truth, then stack a set of defenses in front of it to reduce the traffic that actually reaches it to a level it can handle.
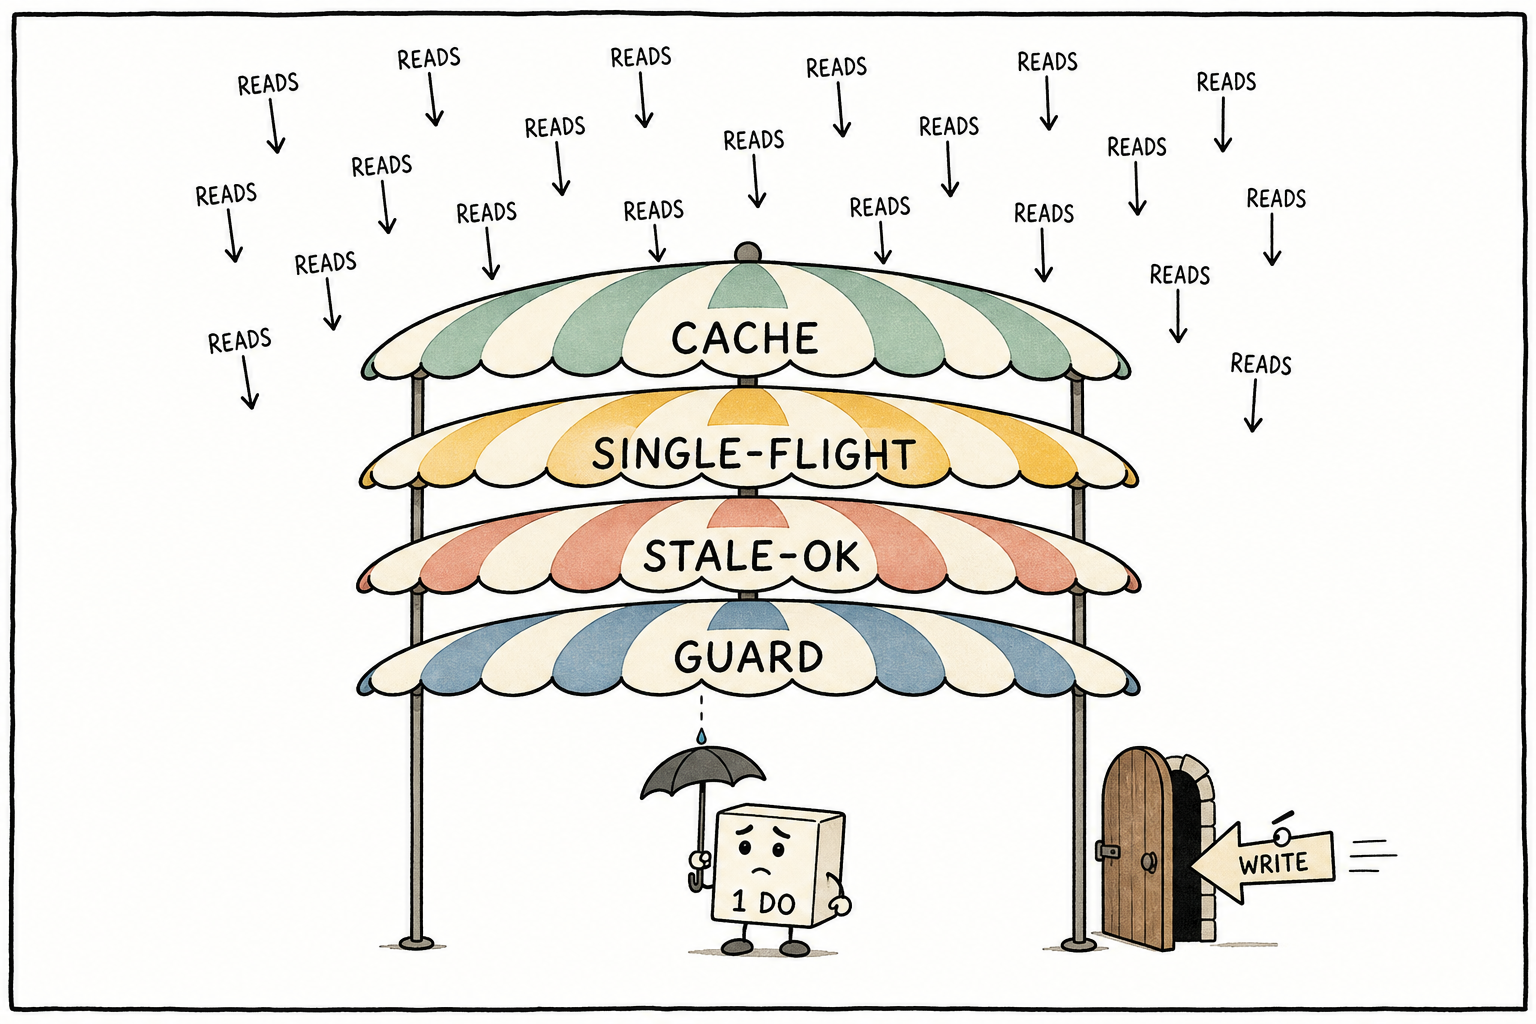
The four layers of defense each absorb part of the traffic:
- Edge cache (
caches.default): each Cloudflare data center has one shared cache, so most reads return from the node closest to the user. - single-flight: within the same isolate, concurrent origin fetches for the same key are merged into one via a
Map<key, Promise>. - Stale-While-Revalidate: when the cache expires, return the stale value to the user first, then refresh slowly in the background so the user does not wait.
- null placeholder + degraded empty response: nonexistent keys get short-lived placeholders to prevent penetration; when the system really cannot keep up, the read path does not return error codes either, but always returns a 200 empty response with a degradation header. The frontend shows any non-200 to the user, so this rule was taught to us by user feedback.
There are also two inconspicuous but important decisions. First, dual TTLs: logical freshness (1 second for result keys) governs “whether this value counts as stale,” while storage TTL (900 seconds) governs “how long the cache entry itself stays.” The two are separated so stale values can keep serving as a fallback. Second, hot/cold separation: hotspot keys are routed by hash to dedicated shards and separated from ordinary keys, so a hotspot storm does not splash onto everyone else.
First Incident: Writes Were Crushed by Reads
One night during result drawing, the write path collectively fell over: the SET success rate dropped to 4%, and the slowest write hung for 17.3 seconds before failing. The postmortem found that cache origin fetches were not merged at the time. At the instant results were drawn, tens of thousands of read requests each knocked on the same single-threaded DO, filled up the queue, and left ball-by-ball writes stuck at the back with no chance to run.
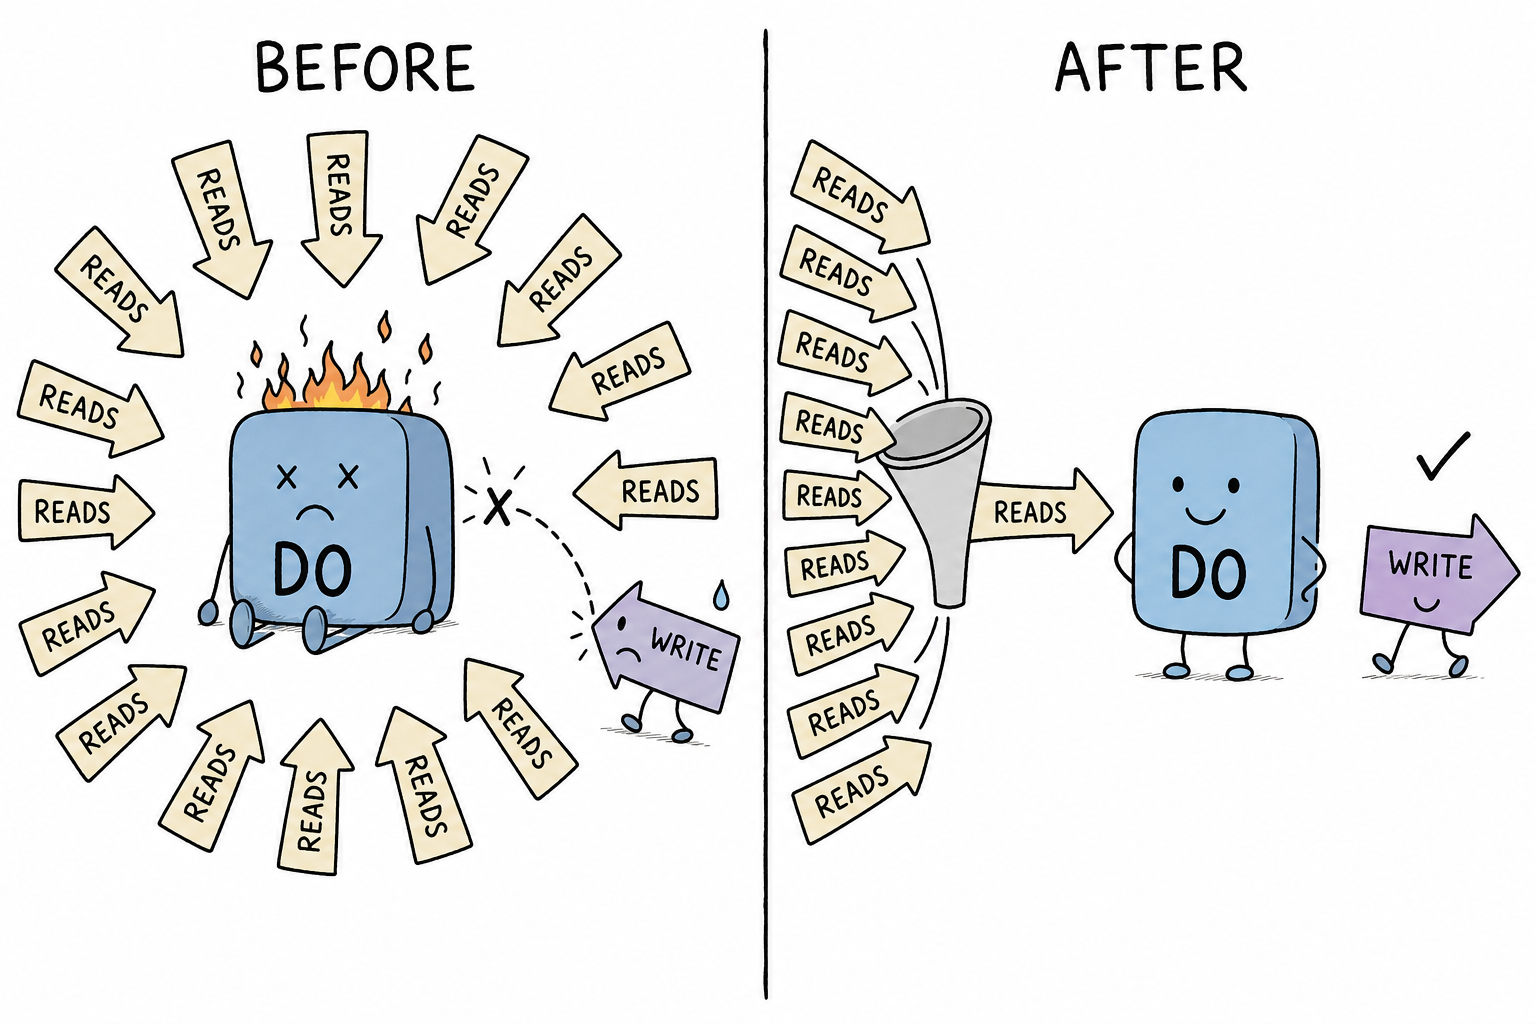
The fix was to add single-flight, while also reducing the logical TTL of the draw key to 1 second. Retesting under the same load:
| Metric (same load, same key, 5 minutes each) | Before fix | After fix |
|---|---|---|
| SET success rate | 4% | 100% |
| Read new value within 5 seconds after write | 6% | 99.7% |
| Slowest write | About 17 seconds | Sub-second |
After rollout, the first real draw saw 58% more traffic than the incident night, and DO errors went from 7 to zero. At the time, we thought the matter was closed.
A $5 foundation, 860,000 RPS in load testing
The system runs on the Workers paid plan, starting at $5, usage-based, with no always-on machine. The reason it is cheap is not penny-pinching, but that read RPS and cost are decoupled: reads are absorbed by edge cache, and the amount that actually penetrates to the per-invocation-billed DO is negligible. During load testing, read throughput was pushed to 850,000 per second, while the DO side only added ten or twenty thousand calls per minute.
So 860,000 was not the upper limit of this architecture, just the upper limit of our load generation that night. However much we sent, the edge served that much, and the curve kept rising.
Second incident: thinking it was fixed
In the week after single-flight went live, every draw would still produce one or two failed write cards, with latency stuck precisely at 16050 milliseconds. The number was too neat: we had added an 8-second timeout plus one retry to DO calls, 8000 + 50 + 8000, and both attempts timed out. In other words, that DO ignored us for a full 16 seconds.
We tried three approaches in sequence, but none removed the root cause:
- Added timeouts and retries to both reads and writes. Failures dropped from 5 cards per draw to 2, and 30-second hangs became capped at 16 seconds, but the retry still hit the same jammed DO.
- Scheduled prewarming. We found that a hot DO would be evicted by the platform after about 2 seconds of idleness, so we added cron to ping all hot DOs every 2.5 seconds during the draw window. Prewarming did take effect (the baseline rose in monitoring), but failures continued.
- Forced the test environment's DO to restart 10 times per minute, trying to reproduce dropped connections. With 600 concurrent requests, latency was pushed to 23 seconds, but every request still succeeded. A single machine could not reproduce it.
Only after placing the minute-level data from two failure scenes side by side did we see they were two trigger conditions with the same root cause:
| Scene | Load at the time | DO errors | Explanation |
|---|---|---|---|
| Evening draw | worker 420,000/min, DO calls 127,000/min | 2725 and 4012 in the two failed minutes respectively | A flood of reads filled the single DO queue, and writes timed out at the tail |
| Daytime draw | About 60 RPS site-wide, near idle | 183 in that minute | The platform migrated/restarted this DO, and it happened to collide with writes |
It also blew up while idle, which meant the second trigger had nothing to do with traffic: the platform simply moved the DO to a new home, and in-flight requests were cut off. Under high load, meanwhile, the main force of the flood was not cache misses either: cache entries lived for 900 seconds, so true misses almost never happened. It was SWR background refresh. The value became stale once every 1 second, and every isolate in every data center independently sent one background origin fetch per second. single-flight could only merge concurrency inside a single isolate; it could not stop hundreds of isolates from firing a volley every second.
The root cause was one thing: all reads and writes for one hot key were lined up in the same queue of the same single-threaded DO.Once reads reached a certain volume, writes were doomed.
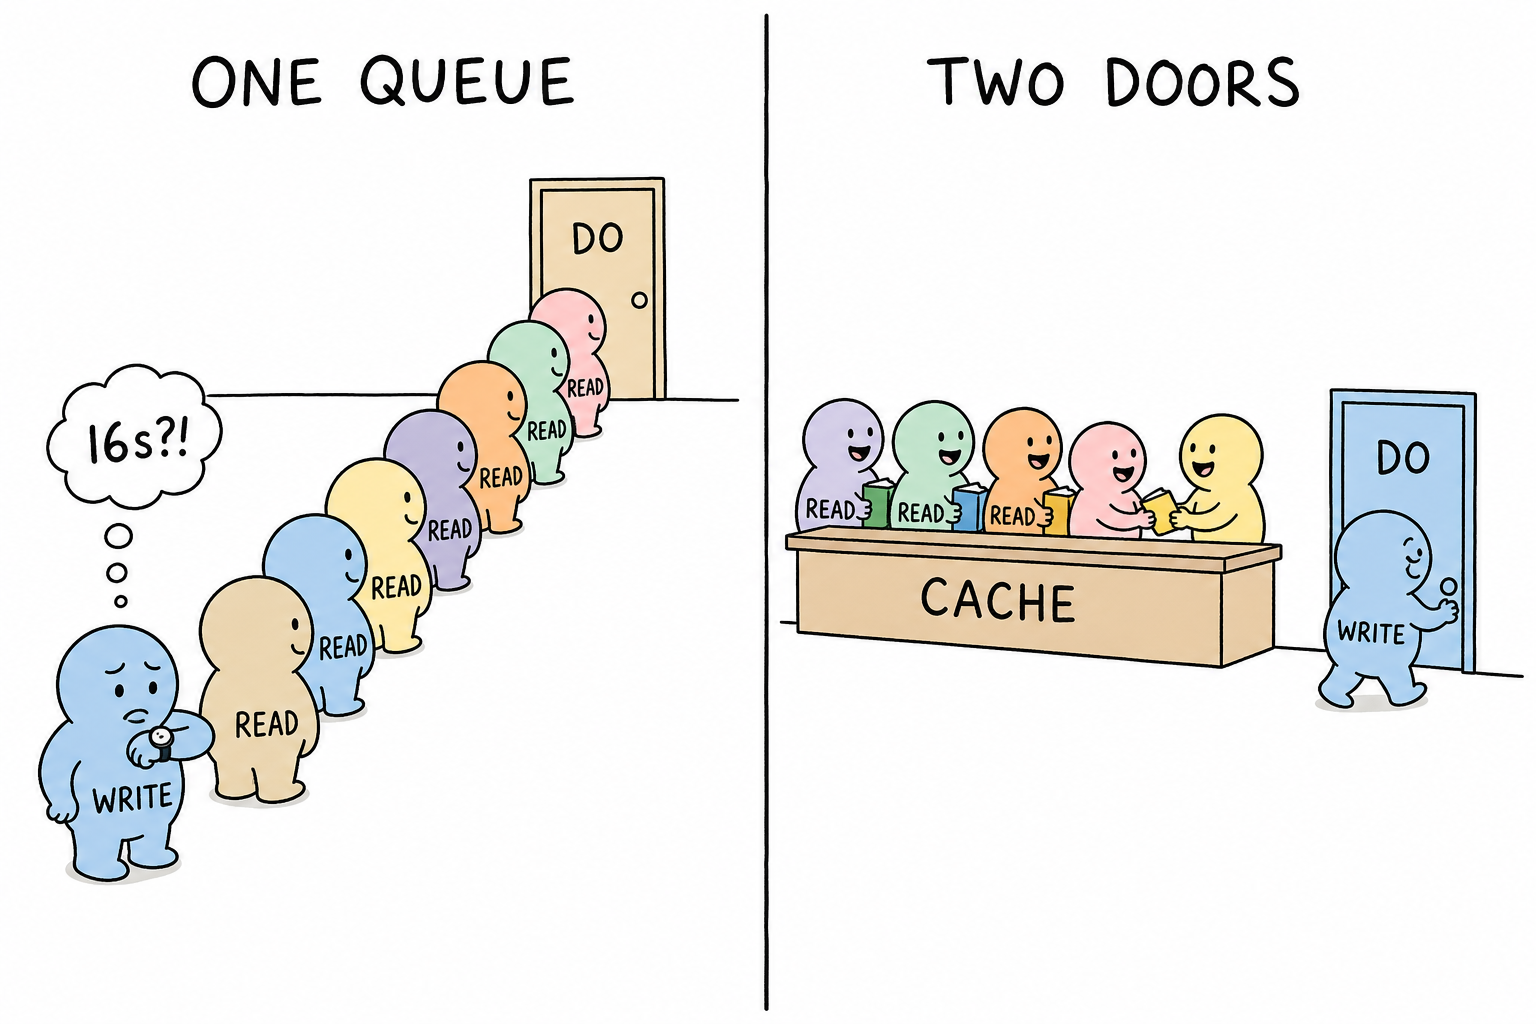
The solution: separate reads and writes, and clarify what "strong consistency" means
We took the plan to GPT and had it act as an external reviewer. It rejected two candidates: relaxing TTL was only a stopgap, since reads would still enter the write DO's queue; making K synchronous replicas was worse, because writes would have to wait for K ACKs, increasing tail latency and failure rate, ultimately amounting to reinventing quorum ourselves. Its main direction matched our judgment. The original wording was: do not add more timeouts and retries to SET; make sure SET never has to queue with user reads.
Implementation happened in three steps:
- TTL was raised from 1 second to 2 seconds.The refresh storm frequency equals 1/TTL, so a one-line change cut it directly in half.
- User reads almost no longer synchronously hit DO.If the cache has a value (even stale), return it directly; throttle background refresh. A true fully empty miss (first read in a cold data center, rare) runs a 1.2-second limited race: if the DO is healthy, return real data directly; if it is down, degrade to an empty response while continuing to backfill in the background. We hit a pitfall here: at first we returned 503, causing the frontend to pop an error dialog. Users taught us: degradation should fall into semantics the caller already knows how to handle, not invent a new error code. From then on, the DO only saw "rate-limited background refresh plus writes", and writes had the queue to themselves.
- The write retry interval changed from 50 milliseconds to 1.5 seconds.A retry after 50 milliseconds usually still hit the same DO mid-migration; 1.5 seconds was enough for it to land in place.
The cost has to be stated plainly. Freshness for user reads changed from “nominally 1 second” to “bounded at 1 to 2 seconds.” The previous setup with caches.default plus SWR could not provide strict read-after-write in the first place; nobody had just said it out loud. Now the promise was rewritten into two honest sentences: the write side is strongly consistent, and every write either succeeds or fails explicitly; the read side has bounded staleness of 1 to 2 seconds. Only after the business confirmed that was acceptable did the architecture close the loop.
First night online: data cut in half, but the root still had a breath left
For the draw on the night read/write separation went online, compared against the same window from the previous night:
| Metric (40-minute draw window) | Night before change | Launch night |
|---|---|---|
| Total DO errors | 6,738 | 325 (-95%) |
| DO call peak | 127k/min | 61k/min (-52%) |
| Write failures | 2 writes, 16.0s | 1 write, 17.5s |
| Slow operations | 4 writes | 1 write |
The direction was completely right, and the magnitude was cut in half, but the acceptance lines we had set for ourselves were “zero write failures” and “DO calls collapse by an order of magnitude.” Neither was reached. After digging, two gaps remained.
First: the throttling granularity was wrong. “At most one refresh per isolate per second” looked tight, but during a draw, 6000 RPS would make Cloudflare spin up hundreds or thousands of isolates. Many of them were brand new, with empty throttle tables, so each allowed one refresh on the first beat. The actual refresh volume hitting the DO was isolate count times key count. Once isolate count rose, throttling was basically meaningless. The fix was to raise the lock from isolate level to colo level: use caches.default (which is already one copy per colo) to place a 1-second lock, so for the same key in the same colo, only the isolate that gets the lock actually goes back to origin. Refresh volume dropped from “isolate count × key count” to “colo count × key count.”
Second: three old endpoints bypassed the entire defense. This system had evolved through several versions and left behind a few bypass read endpoints that “connected directly to the DO and skipped cache.” No matter how well the main path was fixed, as long as a consumer polled hot keys through a bypass, reads would still squeeze into the write DO’s queue. The fix was to make bypasses cache-first for hot keys too: if there is a value, even a stale value within 2 seconds, return it directly; only if there truly is nothing do we allow the original synchronous origin fetch. The response structure did not change by a single character, so no existing caller would break.
While we were there, we increased write retries from two to three, with backoff increasing from 1.5 seconds to 3 seconds, giving a migrating DO a longer window to land. The worst case, 28.5 seconds, still stayed within the platform’s 30-second wall.
The real culprit caught: what blocked writes was not traffic, but disk
After phase two went online, the read side went completely quiet: at the peak of the draw, the whole system only sent three thousand calls per minute to the DO, one-fortieth of the pre-change level. But every night there were still one or two writes that exhausted the retry budget and failed. Who did it? We installed a “dashcam” for write failures: at the instant of failure, it automatically sent a ping to the same DO, captured its state, and attached it to the alert card.
The next day, it caught the shot. For two 30-second failures, every ping timed out, and the error message said: storage operation exceeded timeout.
The weight of that line needs explaining. The ping does not touch disk; it only asks, “Are you alive?” Yet even that question got no answer. The reason is an internal rule in Durable Objects: as long as one disk operation has not finished, it closes the door and accepts no new requests (officially called the input gate, for data consistency). So the truth was: the DO was perfectly alive; it was stuck behind the door by one blocked disk operation. At the peak moment of the draw, the storage layer in the colo where the DO lived could stall for 20 to 60 seconds. Our traffic had already been cleared of suspicion, and this time even the DO itself was cleared. The only thing left was the disk under its feet.
Then came the most valuable realization of this whole investigation. This system’s consistency had relied, from start to finish, on “having only one clerk”: all writes queued through the same single thread, so the order naturally could not get scrambled. Whether or not it was carved onto a stone tablet never affected the ledger’s authority. But our write confirmation had always been tied to “whether the disk was healthy in that exact second.” That was the coupling we needed to break.
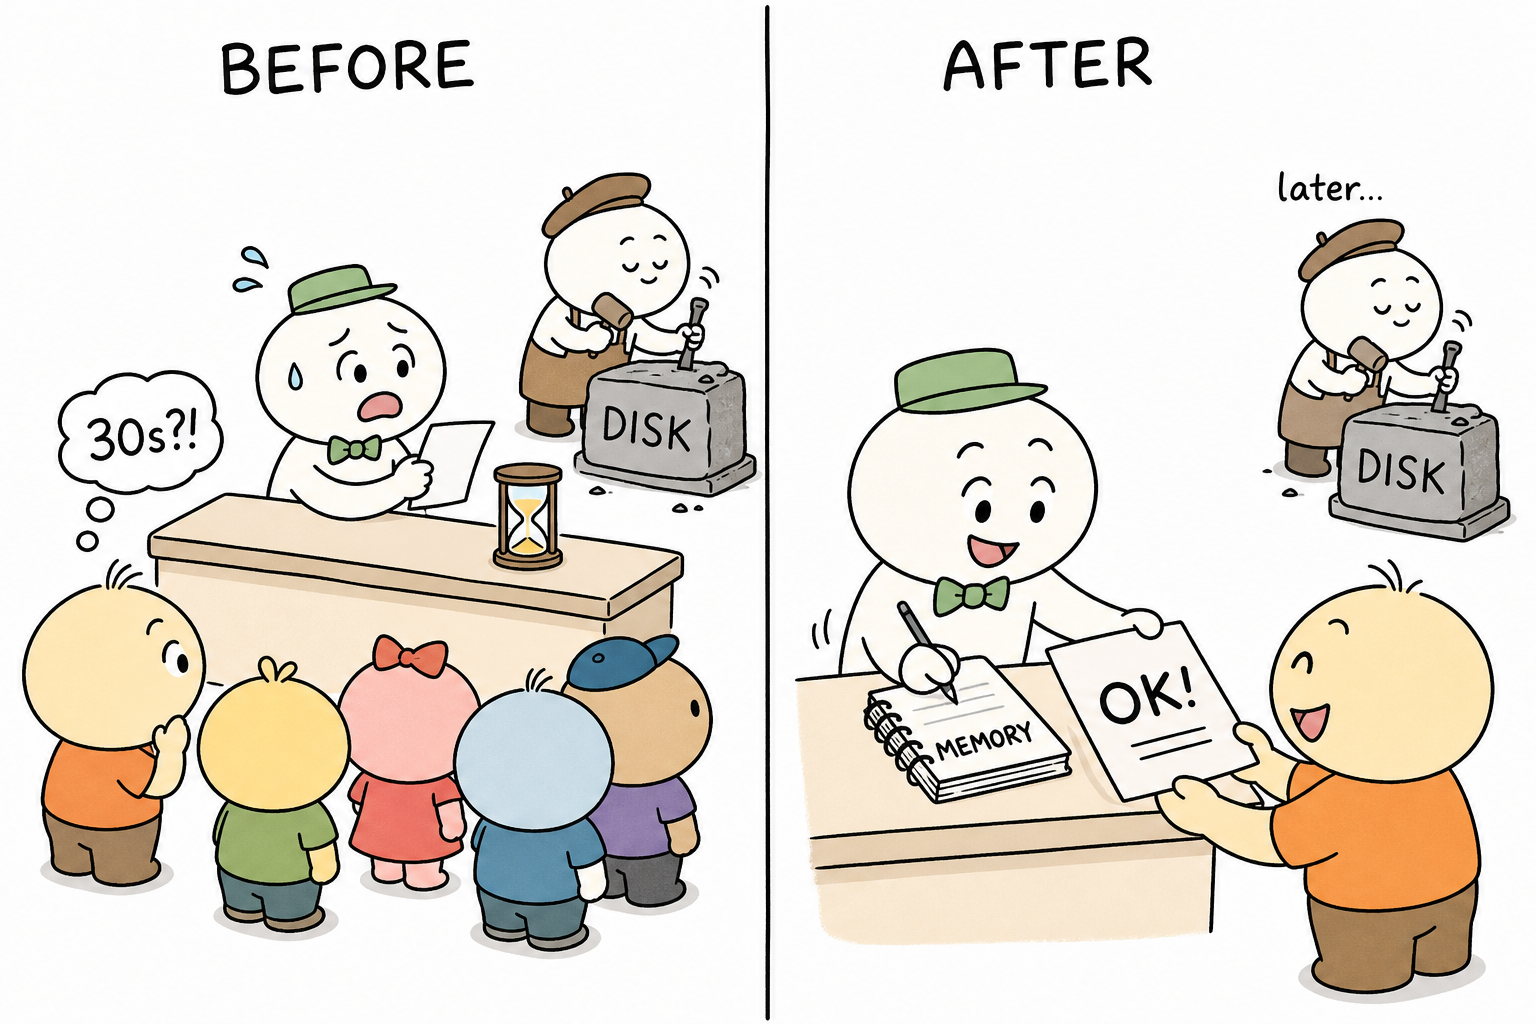
In plain terms, the change was just three sentences:
- Put a ledger by the clerk’s hand.When a write request arrives, first record it in the DO’s own memory, then immediately return “success.” The ledger is the authority, because there is only one clerk, so the accounting order cannot get scrambled.
- Let the mason carve slowly.Move persistence to the background (natively supported by Cloudflare,
allowUnconfirmed); even if the disk stalls for 60 seconds, it does not affect the earlier response, and once it recovers, it will naturally get carved in. - Set two safety rules.Old late-arriving entries may not overwrite new ones (each write carries a timestamp guard, preventing a delayed backfill write from covering a newer ball back to an older ball); if the entire DO goes unreachable, the outer layer still has a guarded background backfill write, retrying once each after 4 seconds, 12 seconds, and 24 seconds on failure.
Only the hot draw keys take this path. Data like history that needs to be kept for a long time still waits until the stone tablet is carved before responding, exactly as before; not a single word changed there. The colo storage freezing under peak load is itself a platform illness, and the ticket still gets filed, but our writes no longer get sick along with it.
Honest retrospective: what was fixed and what still was not

Fixed: read-path single-flight; read/write timeouts plus retries; alert severity split for 4xx and 5xx (before, a client typo in one key would also blow up into a red alert); scheduled prewarming for hot DOs.
Not yet fully converged: an earlier version used 8 central DOs plus long-lived WebSocket connections to hold up two thousand concurrent users, with high complexity, and some tail-end pieces still have not been deleted; using whether the key contains open or current to identify hotspots is crude but has never been wrong; the datacenter storage freeze during peak hours is still owed one platform ticket.
Looking back, what this system got right was not in any single component, but in several judgments: a single-threaded object is slow and can be casually moved away by the platform, but it is serial, and serial means consistency, so design along with it instead of fighting it; when reads grow by dozens of times, the way to keep cost basically unchanged is to block the reads at the edge; monitoring does not need heavyweight logs turned on: push business events into persistent cards, add the platform’s built-in minute-level metrics, and both incidents were investigated clearly with just these two things.
After the first incident, we declared victory as soon as we fixed it; only during the second did we realize the root was still there. Phase one cut the data in half, phase two pressed the read side down to one-fortieth of normal, yet every night there were still one or two 30-second write failures left, until the dashcam finally caught the hard drive and closed the case.
Then came the first drawing after the in-memory ledger went live: traffic that night was the second-highest of these six nights, write failures 0, slow operations 0, DO errors dropped from triple digits to 1, and the slowest write was 1.68 seconds, still a history key going through synchronous disk persistence. All drawing hotspot keys were sub-second. Did the hard drive stall that night? We do not know, and no longer need to know. That is exactly what decoupling means.
Enough zeros had been collected. On the second night, traffic was still close to the peak at 470,000 per minute, write failures 0, slow operations 0, and this time even DO errors and worker errors were both 0. For the first time, every metric landed at zero with nothing left over.
Counting from the night writes collapsed, it took twenty-some days and three cuts: first merge the reads, then separate reads and writes, and finally take write acknowledgment out of the hard drive’s hands. Before each cut, we thought the previous one had already been enough; the reason for every cut came from that night’s production data. Now, two clean nights in a row. This section is done.
 WeChat Pay
 Alipay
Comments
Replies are public immediately and may be moderated for policy violations.